
Oil is not one price and not one headline. This visual briefing puts the physical flows, inventory buffers, positioning limits and Brent curve on one page, so the market can be scanned before it is interpreted.
01 / The market in 90 seconds
Flows recovered. Resilience is still the question.
The October IEA Oil Market Report described a sharp September recovery in Gulf producer crude exports and transit flows. That is meaningful evidence of adaptation. It is not the same as a declaration that every route, product supply chain, tanker market and inventory buffer has returned to normal.
The immediate task is to separate what has been observed from what it may mean. A higher flow count can coexist with freight pressure, uneven product recovery and a thinner margin for a new disruption.
The figures are separate, overlapping measures. They are displayed for comparison only and must not be summed into a supply total.
- Gulf producer crude exports13.9 mb/dSeptember 2026, IEA reported
- Hormuz flows10.9 mb/dSeptember 2026, IEA reported
- Pipeline bypass flows5.6 mb/dSeptember 2026, IEA reported
Market dashboard
Four signals, four different levels of confidence
The point is not to turn every observation into a bullish or bearish vote. It is to keep evidence, inference and unknowns distinct.
- 01Observed
Flows recovered
Higher exports and transit flows show adaptation in the physical system. They do not prove spare capacity or normal delivered costs.
- 02Observed
Buffers remain important
The October IEA report described lower observed stocks and constrained on-land availability. A smaller buffer can magnify a new disruption.
- 03Not fully reproducible
Positioning is contextual
Public CFTC reports inform contract-level positioning, but cannot validate the supplied combined Brent-and-WTI percentile.
- 04Conditional
Diplomacy needs proof
The supplied source describes optimism. This note does not treat an unverified narrative as a completed agreement or normalised risk.
02 / Source-study plates
Six market lenses, read in sequence
The supplied chart plates make the study sequence more concrete. Each one is paired with a short Aeora guide to the question it can help a reader ask, rather than a conclusion it can answer on its own.
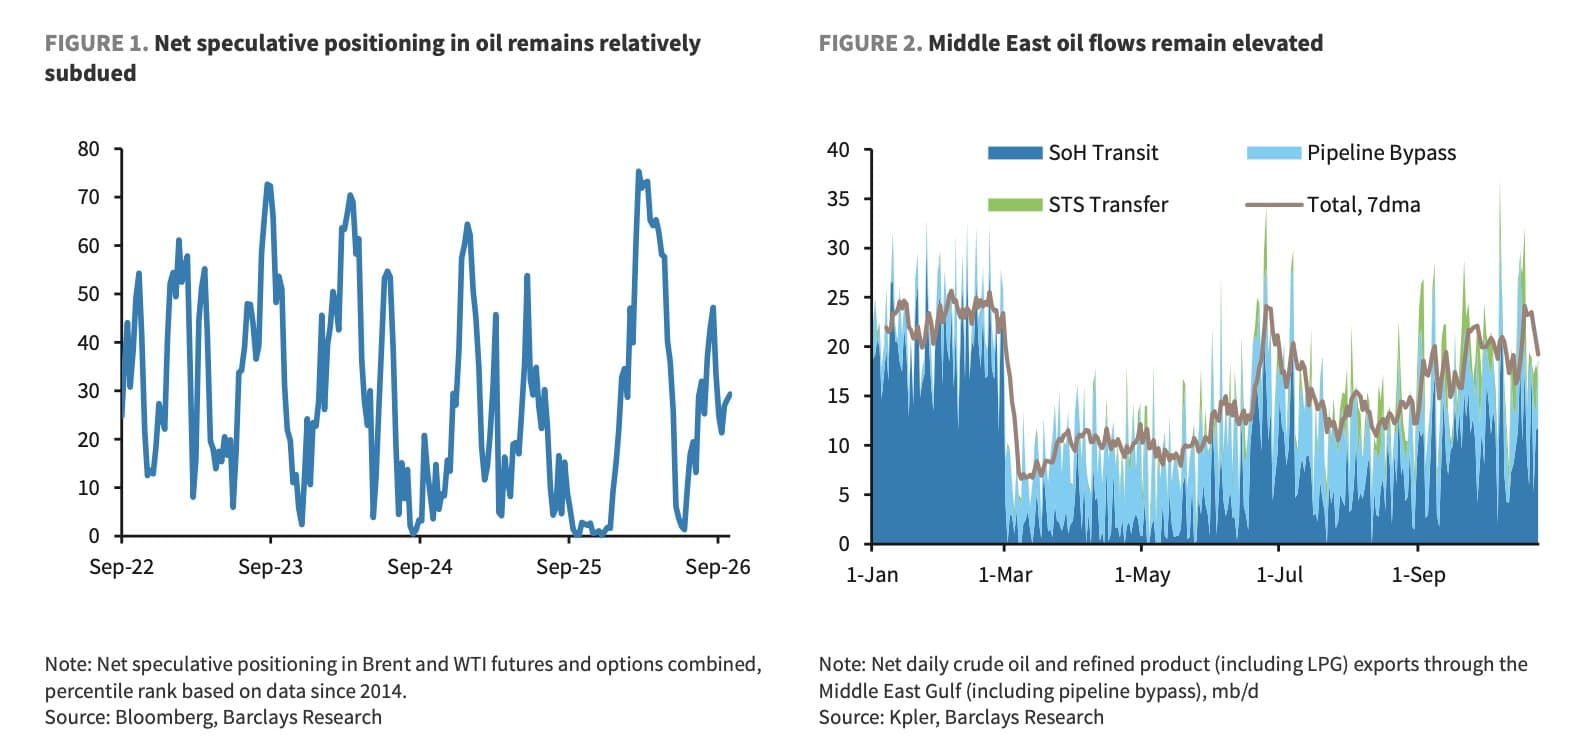
Plate 01Positioning and Gulf flowsOpen full plate Aeora reading guideRead market conviction beside the physical flow
The pair separates market participation from the barrel count. That distinction is useful when a calm-looking futures market sits beside a transport system that remains operationally sensitive.
- Is positioning showing conviction, or simply reduced appetite to carry risk?
- Are flows broadly resilient across routes, products and timing, or concentrated in fewer channels?
- Which part of the route remains most exposed to a renewed disruption?
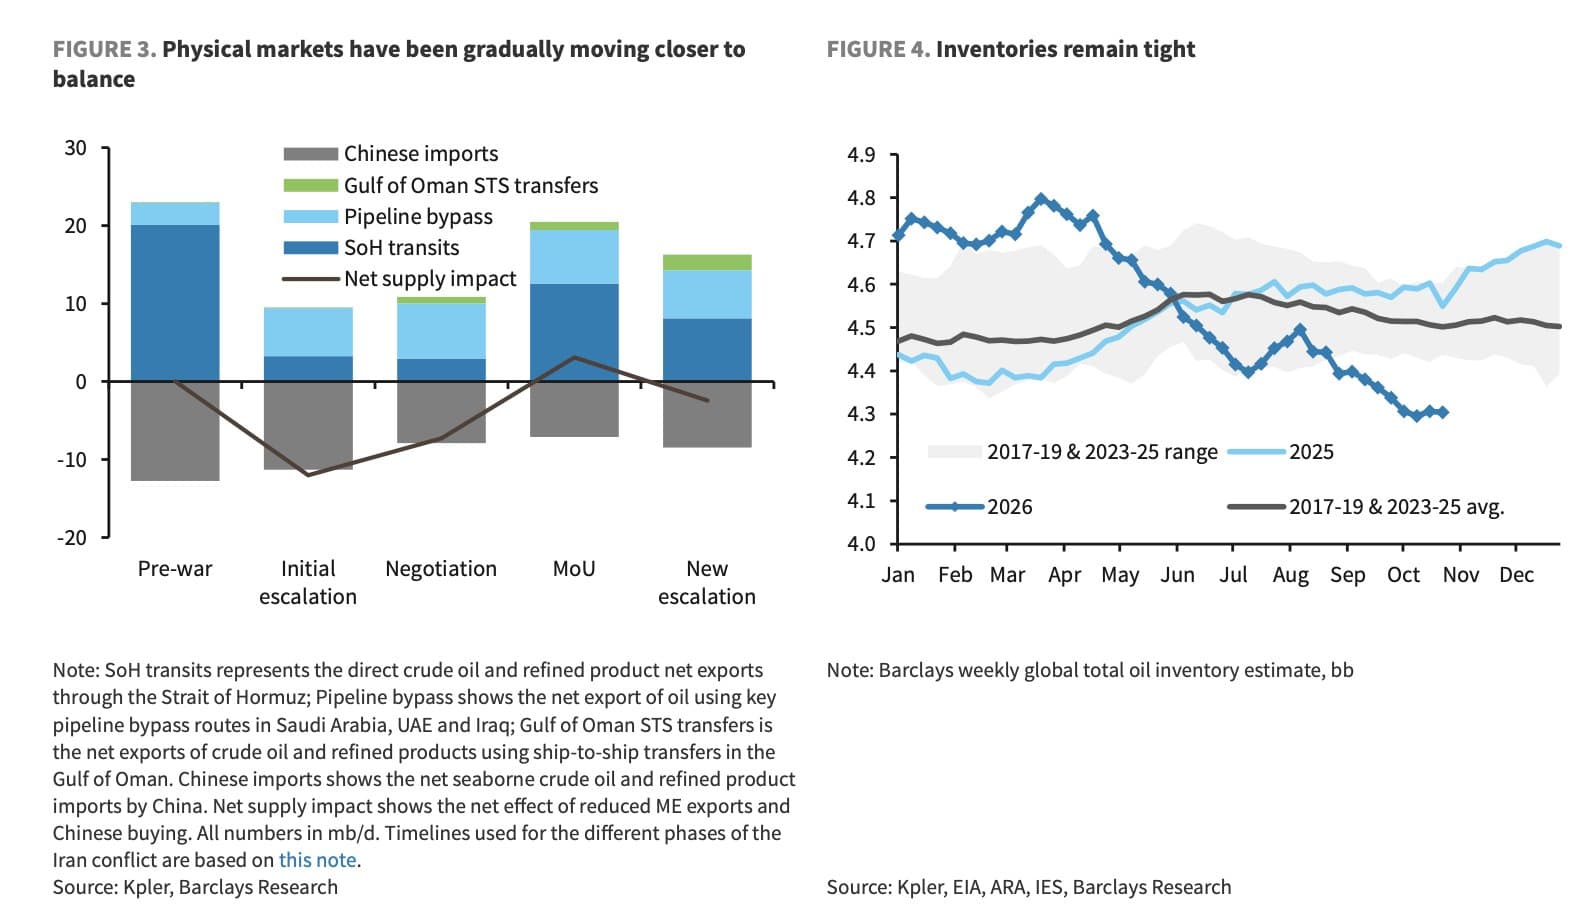
Plate 02Balance and inventory buffersOpen full plate Aeora reading guideTrack the system, then test the buffer
A recovery in visible flows can improve the balance without recreating a comfortable inventory cushion. The study task is to separate a better headline from a more resilient physical system.
- Which offsetting flows are supporting the net balance?
- Do inventory levels provide a meaningful buffer, or only a narrow margin for error?
- Would a change in exports, imports or ship-to-ship transfers alter the read first?
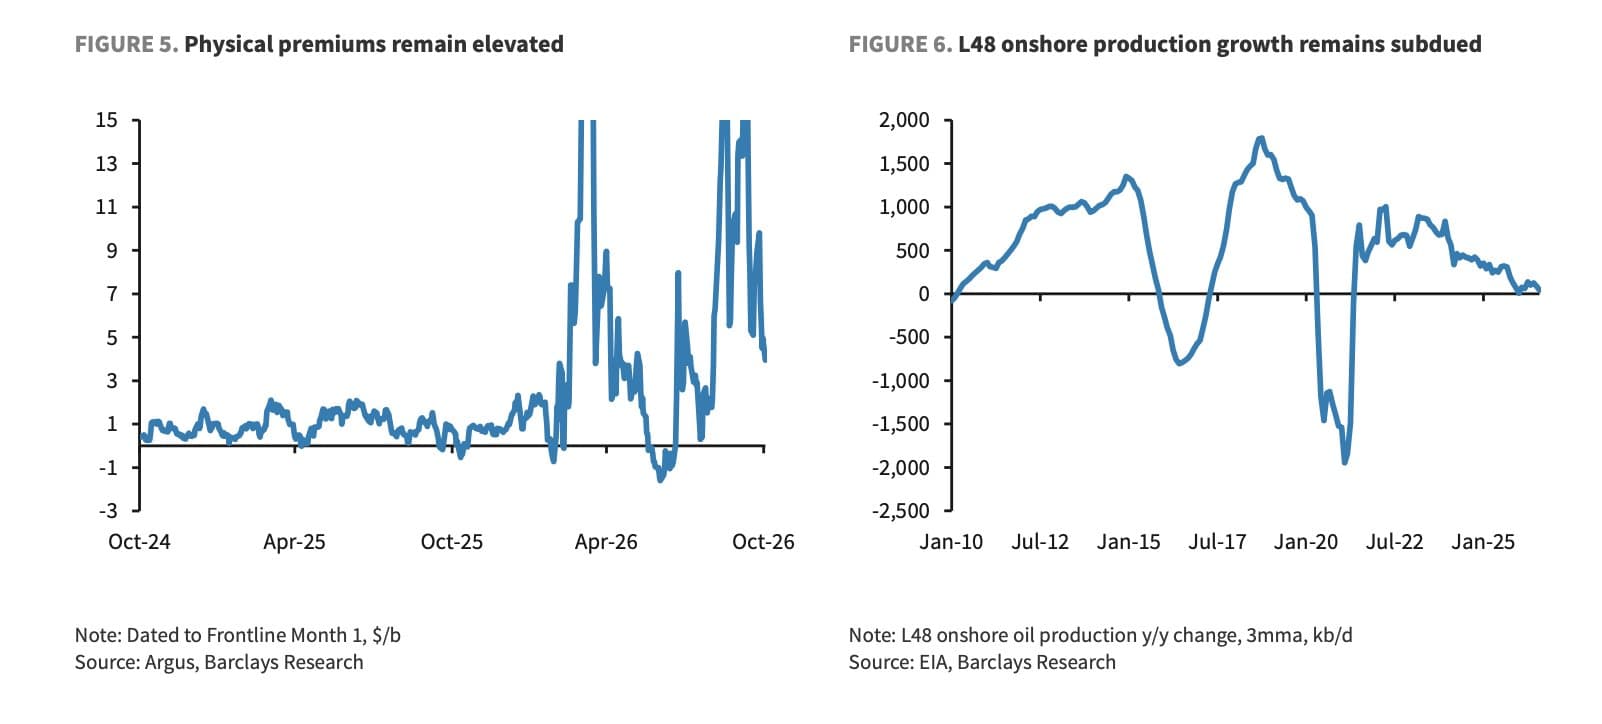
Plate 03Prompt premiums and supply responseOpen full plate Aeora reading guideLet the physical premium speak before the curve
Prompt physical premiums can show where immediacy is being priced. Supply response develops on a different timetable, so both signals matter without being interchangeable.
- Is the premium linked to a specific grade, delivery point or temporary logistics constraint?
- How quickly can available production respond to the condition being observed?
- Does the Brent curve confirm the same scarcity signal, or tell a different time story?
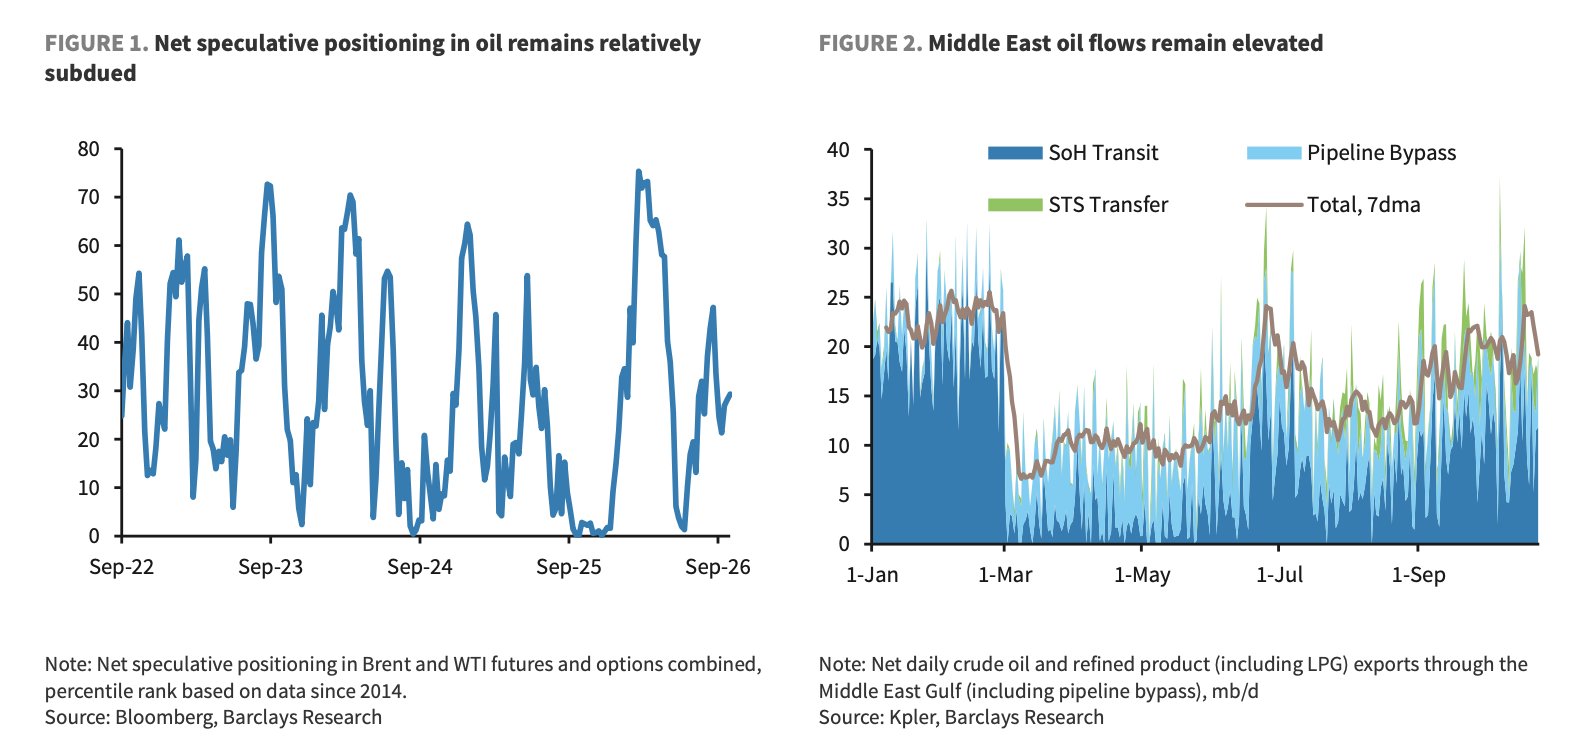
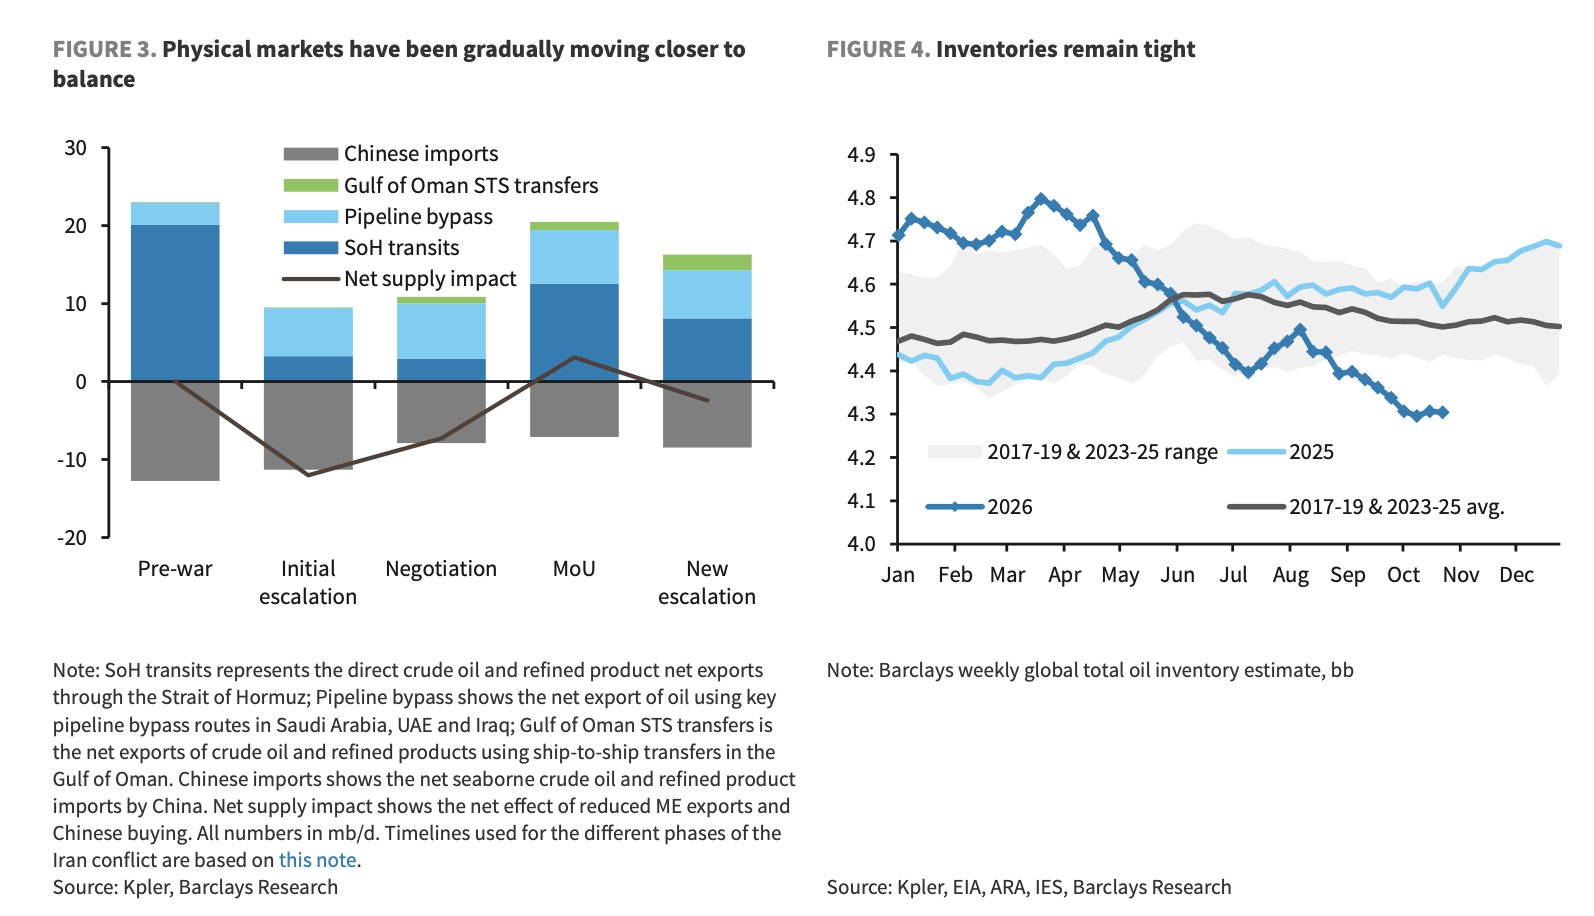
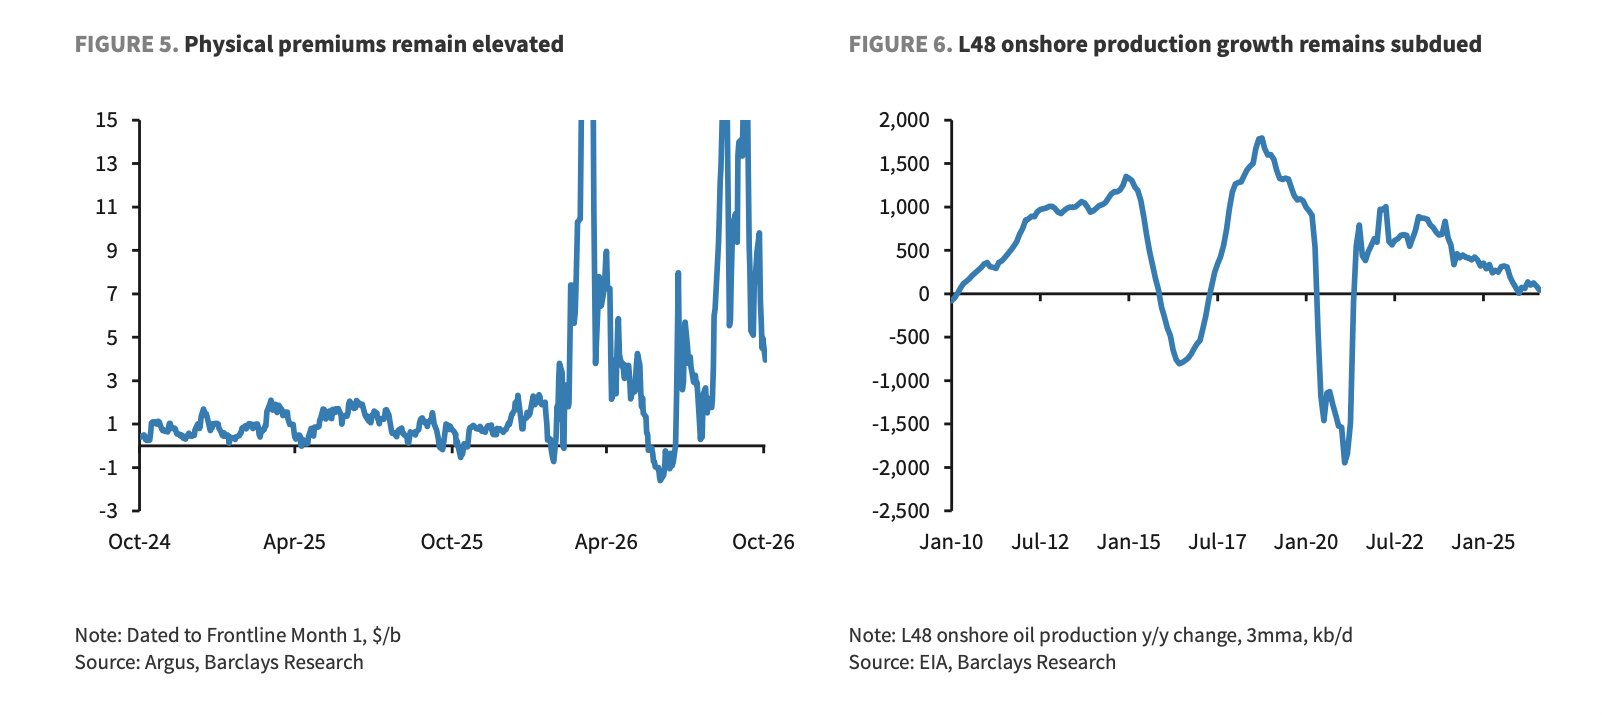
Source note. The study plates are supplied Barclays Commodities Research material presented for educational context. They are not Aeora charts, price targets or trade recommendations.
03 / Physical market check
The delivered barrel is the harder test
A benchmark futures price says something about the market's broad expectations. A delivered barrel has to be loaded, insured, transported, discharged and processed. This is where route risk, tanker availability, freight, quality differences and refinery economics enter the market before a consumer ever sees a fuel price.
The IEA's October report links these channels: a crude-flow recovery occurred alongside elevated freight and pressure on refining margins, while products and LPG recovered more slowly. The visual conclusion is simple: look for redundancy, not just movement. An export figure can improve before a delivery system becomes robust.
04 / Curve, not just price
Brent spreads show which delivery window matters
A calendar spread compares two futures months. It can react to the timing of inventory pressure, physical availability, storage value and risk differently from the flat Brent price. Backwardation can be consistent with prompt tightness; contango can be consistent with carry, storage or more available nearby supply. Neither shape explains itself without physical context.
The historical Barclays reference near $3.40/bbl is not a current quote, Aeora entry level or recommendation.
Benefits if September gains value relative to December.
Offsets outright exposure but creates a relative-value risk.
- Wider spread
September strengthens faster than December.
- Narrower spread
December strengthens faster, or September weakens more.
- What to verify
Curve shape, liquidity, physical premiums, inventories and the timing of any disruption.
05 / Physical premiums
Use a physical premium as a local clue, not a global verdict
A premium for a deliverable cargo can reflect local grade demand, freight, terminal access, refinery suitability and immediate supply availability. When a firm premium and a strong nearby curve agree, they can reinforce a prompt-tightness reading. When they disagree, the difference can be the more informative signal.
The supplied Barclays material uses licensed Argus assessments for its physical-premium chart. Aeora does not recreate the series or infer exact values from the screenshot. A premium is most useful when it is read with its grade, delivery point, timing and market methodology in view.
Scenario radar
Watch for the evidence that changes the story
- A
Re-escalation
A verified transit, loading, tanker or infrastructure disruption.
Curve readPrompt or mid-curve scarcity can become more valuable than deferred supply.
- B
Extended uncertainty
Exports move, but workaround routes, freight and insurance remain expensive.
Curve readRelative-value behaviour can matter more than a dramatic flat-price move.
- C
Credible de-escalation
A verified, implementable agreement reduces operating and policy frictions.
Curve readRisk premia and time spreads can normalise if physical resilience follows the headline.
06 / Malaysia relevance
For Malaysian traders, follow the transmission chain
Global supply, demand and risk conditions shape the benchmark and the curve.
Energy shocks can interact with inflation expectations and the currency through more than one channel.
Feedstock, transport and substitution effects can matter at the margin, but the relationship is not fixed.
07 / What changes the view
A short list for the next research pass
- Verified diplomatic implementation, rather than unconfirmed optimism
- Crude, product and LPG flows separated by route and reliability
- Freight, insurance and tanker availability alongside the flat price
- Commercial inventory changes by region, stock type and product
- Brent curve and physical-premium behaviour, with liquidity context
Aeora visual assessment
The market is more useful when its signals are kept separate.
Flow recovery, a calm headline and a weaker flat price can all be true at once. The research discipline is to test those observations against buffers, logistics and the curve before treating them as a market conclusion or an execution decision.
Market structure before execution.
Explore Aeora Trader Development