Geopolitical tension is resurfacing as WTI revisits one of the most important technical decision areas of 2026. The confluence is notable; the outcome is not inevitable.
The supplied charts are TradingView FXCM CFD Crude Oil (WTI) charts, not necessarily the exact NYMEX CL front-month futures series. CFD pricing and rollover methodology may differ from exchange-traded futures. Article levels primarily refer to Aeora Research's FXCM CFD reference chart; historical comparisons are broad structural observations rather than exact cross-contract settlement comparisons.
01
2026: Conflict, easing and repricing
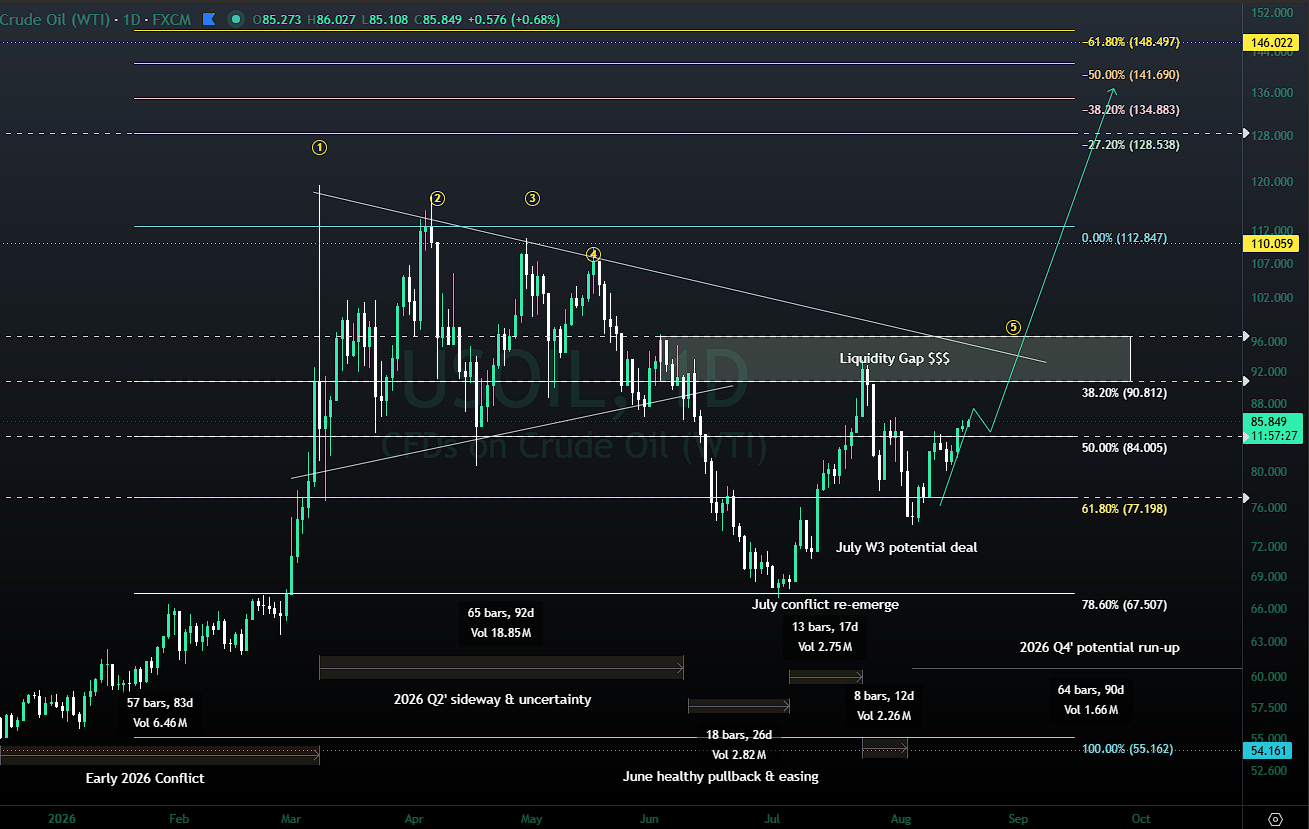
Aeora's daily map begins near $55 in late 2025 and reaches roughly $119.50 after about 83 days. That is a 117.27% move, close to the chart's rounded +117% annotation. The advance coincided with a major conflict-repricing phase, but geopolitics cannot explain the whole move. Physical supply expectations, exports, shipping capacity, sanctions, OPEC+ policy, inventories, demand, positioning and the dollar all influence crude at the same time.
The vertical repricing then gave way to a 65-bar, roughly 92-day Q2 digestion between approximately $85 and $110. A June-July decline of about 30% carried price toward $67.50, almost exactly the chart's daily 78.6% Fibonacci reference at $67.51. This was confluence, not causation: easing expectations and changing probabilities met a technically important retracement.
The following rebound was equally instructive. From around $67.50 to approximately $94, WTI recovered 39.26% in roughly two weeks. A later perceived-deal headline phase pulled price back toward $74, about a 20% decline from the recovery high. From that area, early-August price action recovered approximately 15%-16% into the current $85-$86 region. The lesson is not that every headline should be traded. It is that crude's risk premium can be added and removed with unusual speed when the expected path of shipping, exports or conflict changes.
 Open full resolution
02
Why $84-$85 matters now
The daily 50% retracement sits at approximately $84.00. The same area also marks the former lower boundary of the Q2 range and has now been reclaimed. That gives $84-$85 three roles: a Fibonacci pivot, a structure test and a gauge of whether the latest recovery can retain momentum.
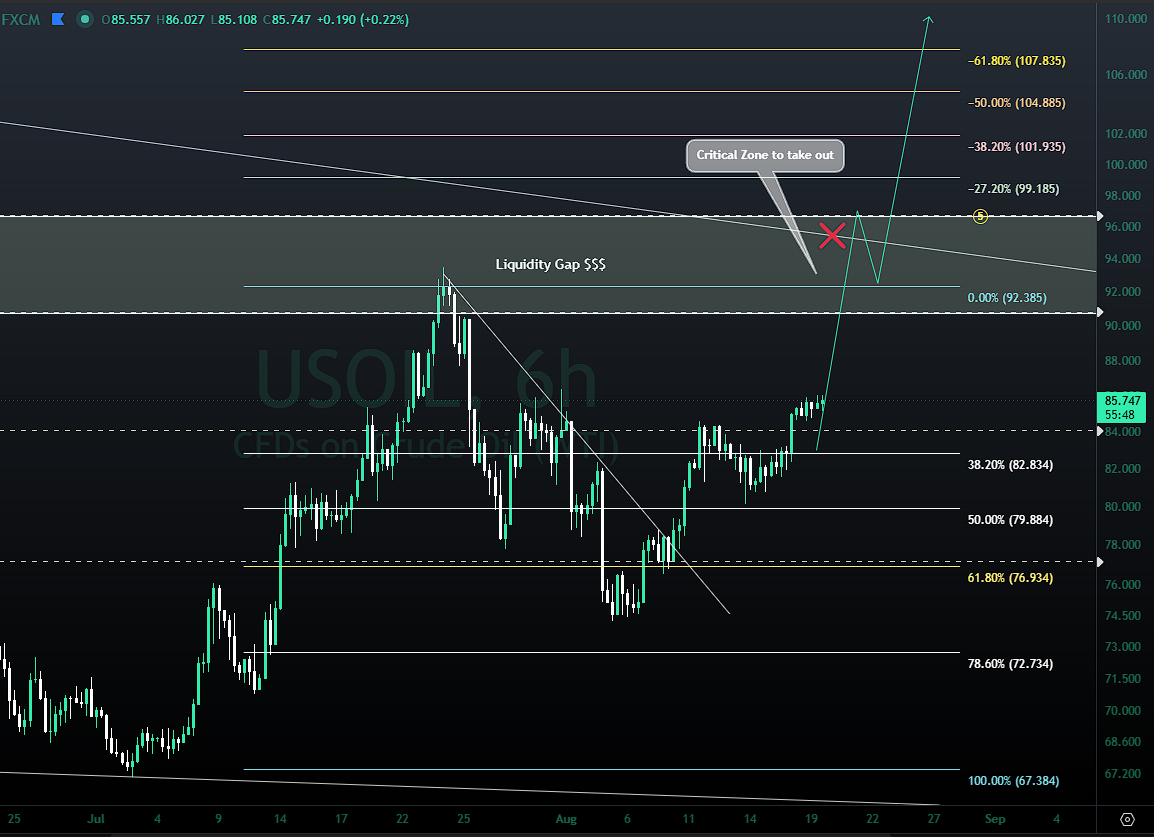
Holding above it would preserve a sequence of improving short-term lows. Losing it would not automatically return price to the July bottom, but it would weaken the recovery and refocus attention on the H6 references at $82.83, $79.88 and $76.93. On the daily chart, $77.20 and $67.51 remain the larger downside references.
03
The real technical test: $90.8-$96.5
The main decision region lies above current price. Its lower boundary aligns with the daily 38.2% retracement near $90.81; the upper area overlaps a June structural high and the descending trendline from the March region. The H6 chart labels this band as a liquidity gap. We treat that label as a map of potential supply and order interaction, not a promise that price must fill or break it.
A rally into the band followed by rejection would leave the broader corrective range intact. The more constructive case requires several steps: entry into the region, absorption of selling, sustained acceptance, strong closes above it and a break of the descending trendline. Only then would the lower-high structure begin to fail, making $100 and eventually the $110-$120 historical region more relevant. Calling that breakout before it occurs would confuse a scenario with evidence.
 Open full resolution
04
Geopolitical risk is returning at the decision point
The verified backdrop remains unresolved. On 18 August, Associated Press reported that Iran and Oman were close to a plan governing ship traffic through the Strait of Hormuz while Washington objected to elements of the arrangement. AP also reported a projectile strike on a vessel leaving the strait and said the negotiating window for a broader U.S.-Iran peace arrangement was expiring without visible convergence. Reuters separately reported on 17 August that a senior Iranian official described a shift toward a more offensive posture if diplomacy failed.
Those reports sit against competing official positions. Oman has repeatedly advocated safe passage, international law and continued diplomacy. The U.S. Treasury has maintained pressure through sanctions on Iranian maritime and shadow-fleet networks. A 2 August UKMTO/JMIC advisory described reduced Strait traffic, persistent navigational interference and elevated maritime risk. The EIA estimates that 20.9 million barrels per day moved through Hormuz in the first half of 2025, illustrating why uncertainty around transit can influence far more than one regional market.
These accounts do not resolve into one clean story. Tehran, Washington and Muscat are describing different interests, conditions and degrees of progress. The market is not only pricing escalation or de-escalation; it is pricing uncertainty around the credibility, timing and durability of both. Aeora's working view therefore leans toward unresolved negotiation and persistent Gulf-security risk, not toward certainty that a deal will fail.
05
The 90-day observation
The first conflict-repricing phase lasted about 83 days; the following Q2 consolidation measured roughly 92 days. That is enough to establish a monitoring rhythm, but nowhere near enough to establish a model. We are using 90 days, plus or minus, as a Q4 scenario-planning window.
The sample contains only two phases. Geopolitical events do not repeat mechanically, event timing is unpredictable, magnitude changes, technical patterns fail and physical market conditions evolve. The observation tells us when to intensify monitoring, not where price must travel.
06 / Long-term lens
Crude keeps returning to the same upper regime
A crude-oil fun fact that may not be so fun for inflation.
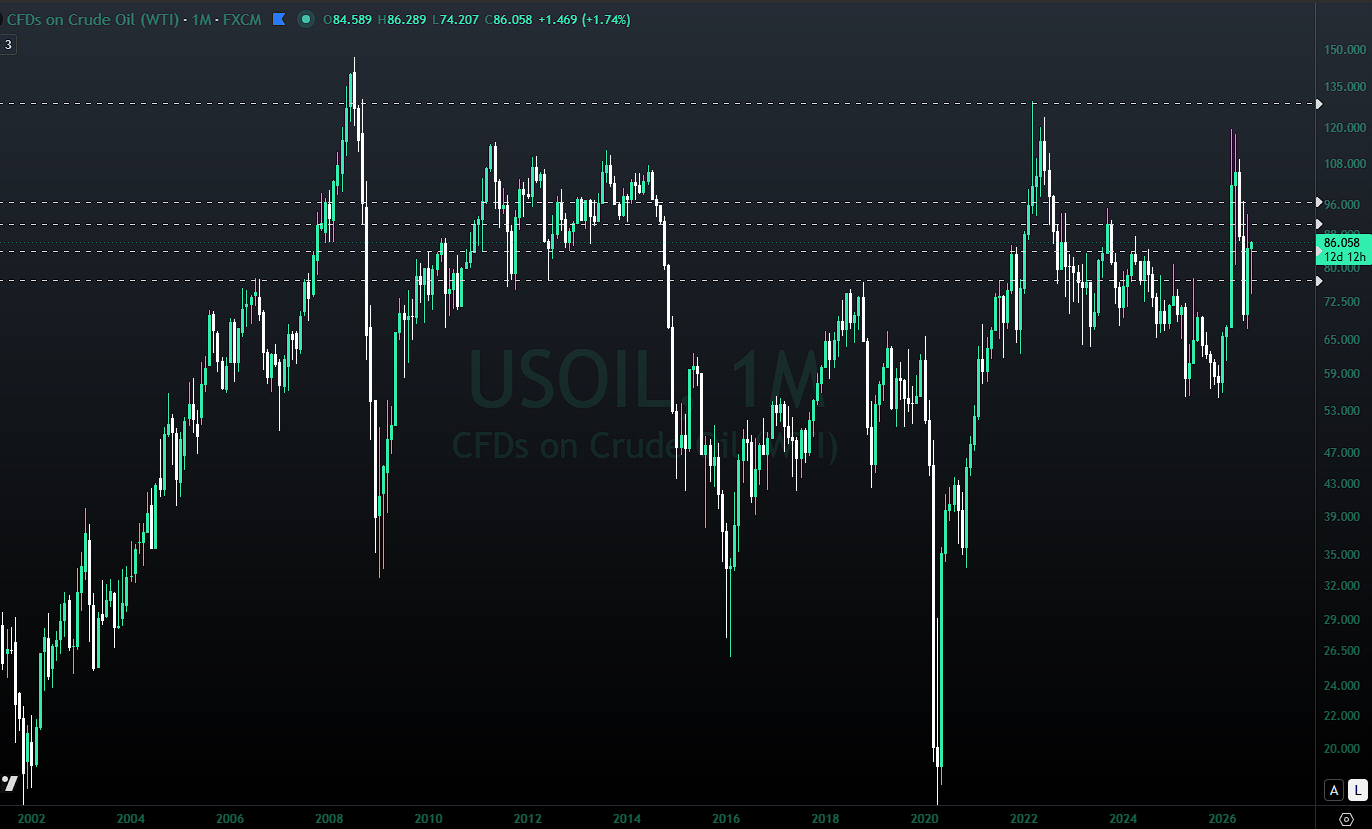
The monthly chart places 2026 inside a much larger structure. NYMEX WTI futures reached an intraday record above $147 in July 2008 before collapsing into the global financial crisis. The oil peak did not cause that crisis, but it remains the defining commodity-cycle high.
From 2011 through mid-2014, WTI made repeated approaches to roughly $100-$112 before a major decline. The supplied chart's $105-$115 description captures the upper boundary, but verified EIA spot data show much of the period traded below that band. The defensible reading is a multi-year upper regime around $100-$112, not three uninterrupted years above $105.
In April 2020, the negative settlement often associated with WTI was specific to the expiring May 2020 NYMEX futures contract amid extreme storage and delivery pressure. It should not be treated as a universal negative print across spot, CFD and every futures maturity. The subsequent recovery carried EIA Cushing spot WTI to $123.64 on 8 March 2022, while the monthly CFD chart presents the move as approximately $125-$130. In 2026, the supplied CFD chart records another peak around $119 and a stronger recovery attempt after correction.
 Open full resolution
07
What happens if an 18-year ceiling finally breaks?
There is no single resistance line connecting $110, $120, $130 and $147. There is instead a broad multi-cycle upper resistance regime, approximately $110-$147, with meaningful sub-zones around $110-$120, $125-$130 and $145-$150. Repeated tests make an eventual sustained break more consequential; they do not make it inevitable. The same regime can keep rejecting price.
A true multi-cycle breakout would require WTI to preserve the current recovery, clear $90.8-$96.5, reclaim $110-$120 and then establish sustained monthly acceptance above the historical upper region. A later challenge of the 2008 high would be another condition, not an automatic destination. Only that sequence would justify discussing a new structural crude-oil price regime rather than another cyclical spike.
08
Why Black Gold could matter for inflation again
Oil enters headline inflation directly through motor fuel and indirectly through freight, aviation, petrochemicals and industrial inputs. BLS assigns motor fuel about 3% of the U.S. CPI basket, while the second-round effects depend on persistence, pass-through and how firms and households form expectations. Higher crude does not mechanically determine core inflation or Federal Reserve policy.
It can still complicate the policy path. On 29 July, the Federal Reserve said inflation remained elevated relative to its 2% goal and explicitly referenced supply shocks, including energy. A persistent oil shock could make disinflation harder if transport and input costs broaden into expectations, wages or margins. A brief geopolitical spike that quickly reverses would be a different macro event from a sustained multi-month regime change.
If crude ultimately escapes a resistance regime that has contained multiple major cycles since 2008, the market may be reminded why oil earned the nickname "black gold."
09
Could oil become an equity-market headwind?
A persistent crude repricing could become one additional macro headwind for the S&P 500 and NASDAQ 100, particularly if it alters inflation expectations and the expected path of interest rates. Higher energy and transport costs can pressure margins and household disposable income; higher expected inflation can lift yields and compress valuation multiples, with high-duration growth stocks often more sensitive to discount-rate changes.
This is not an "oil up, technology down" rule. Energy producers may benefit, commodity-linked sectors can rotate differently, and broad index outcomes still depend on earnings, growth, policy and starting valuations. Correlations change through time. Oil would be a transmission channel, not a standalone crash signal.
10
Three scenarios from here
Acceptance above the decision region
$84-$85 holds, higher lows continue and price absorbs $90.8-$96.5 while geopolitical and physical-market evidence support the move. References then progress through $100, $110-$120 and the Fibonacci extensions at $128.54, $134.88, $141.69 and $148.50. From $85 to $128.50 is 51.18%; from the chart's $85.75 area to $128.54 is 49.90%. These are technical scenario references, not targets or guarantees.
Volatility without structural resolution
WTI remains between the mid-to-high $70s and mid-$90s as geopolitical uncertainty persists without a decisive physical disruption. Repeated headline spikes, rejection at $90-$96 and rapid mean reversion would be frustrating for directional traders, but this may be the most realistic middle path.
The recovery loses its support structure
A credible settlement, normalised transit, lower insurance costs, sanctions relief, stronger exports, OPEC+ supply, shale growth, SPR action, weak demand, inventory builds or a stronger dollar could remove risk premium. A failed $90-$96 test would refocus $77.20, the broader $70 area and $67.51. Sustained breaks through those zones would progressively weaken the constructive thesis.
11
What Aeora Research is watching
- $84-$85 recovery pivot
- $90.81 lower decision boundary
- $96.5 upper supply region
- March descending trendline
- $110-$120 historical sub-zone
- Hormuz shipping and tanker insurance
- U.S.-Iran negotiations and policy-reversal risk
- Oman's mediation and transit arrangements
- OPEC+ and U.S. shale production response
- EIA inventories, refinery runs and physical confirmation
Secondary risks include Iranian export changes, sanctions enforcement or relief, China and India demand, freight normalisation, alternative routes, crowded positioning and liquidation. Similar geopolitical logic can apply to Brent because it is a seaborne global benchmark, but no Brent chart was supplied; WTI levels in this note should not be copied onto UKOIL.
12
Aeora Research view
Our working bias remains constructive while the recovery structure survives, but the thesis does not become technically compelling until WTI demonstrates that it can absorb the $90.8-$96.5 supply and liquidity region.
A sustained breakout would not merely reopen the 2026 highs. It would place crude back against a long-term price regime that has repeatedly contained major commodity cycles since 2008. If that regime eventually gives way, the implications may extend well beyond the oil market.
Important disclaimer
Research, not a recommendation
This publication is prepared solely for general market research, education and informational purposes by Aeora Research. It does not constitute investment, financial or trading advice, a solicitation, an offer to buy or sell any financial instrument, or a recommendation to enter any position.
All views, scenarios, technical levels and projections are research observations and opinions at the time of writing and may change without notice. Forward-looking scenarios, price objectives and time estimates are inherently uncertain and may not occur. Historical behaviour, technical patterns, correlations and geopolitical developments are not reliable indicators of future performance.
Crude oil, commodity derivatives and leveraged products can be highly volatile and involve substantial risk of loss. Readers should verify information independently, conduct their own due diligence, consider their circumstances and risk tolerance, and seek appropriately licensed professional advice where required. Cross-asset observations involving inflation, interest rates or equities are scenario analysis, not forecasts of Federal Reserve policy or stock-market performance. Aeora Research accepts no responsibility for decisions made from this publication.